

As the evolving nature of technology is changing the expectations of their visitors, how can museums design in-gallery digital experiences to stand the test of time?
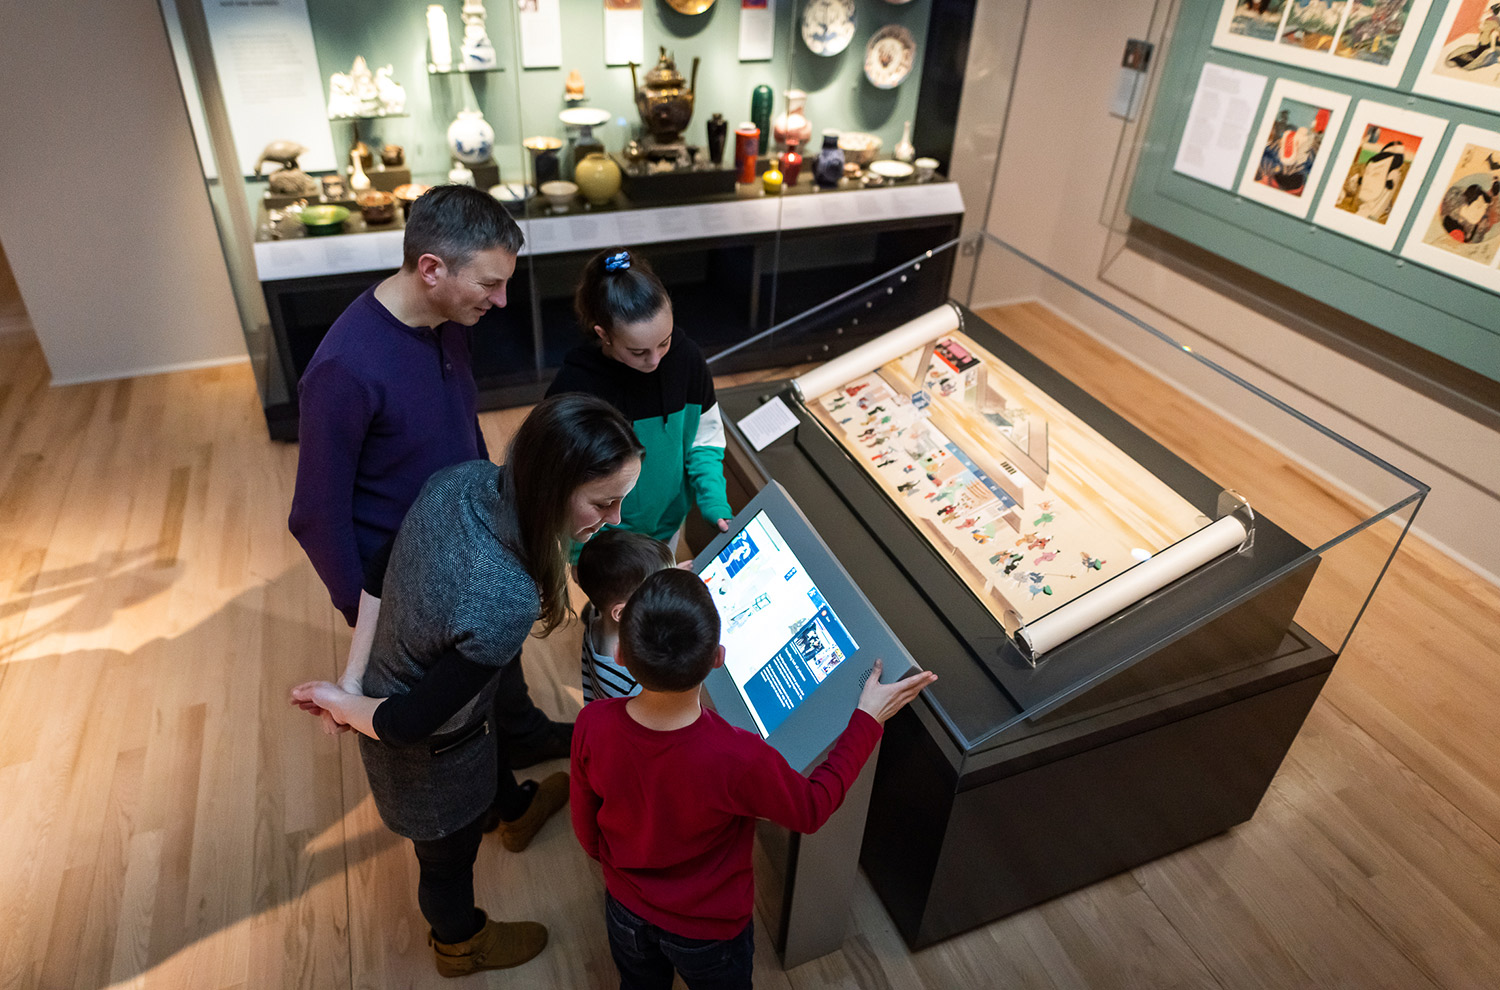
In February 2019 the 15-year transformation of the National Museum of Scotland culminated in the opening of two new permanent galleries, dedicated to ancient Egypt and East Asia. My role as part of the Digital Media Team was to manage the delivery of digital content in these galleries, including five interactives, eight digital labels and two ambient films.
The creative briefs for the interactives had been written (before my time) as a result of a full-day workshop led by Ben Templeton bringing together gallery designers, project curators and members of our Learning team. At the heart of these briefs was an ambition to allow visitors to playfully explore different subjects and a recognition that each interactive had to focus on one or two core actions.
As Ben has stated in numerous talks on game-making: what is the simplest thing you can do to create an emotional connection? Or, stated another way “what are your tastiest patterns?”.
So, whilst we wanted to design experiences that created immediate connections to our visitors, we also wanted to discover what type of connections were being made and how visitors were playing the games.
Our approach to digital design at NMS is increasingly informed by visitor data, so from the start of working with pitch-winners Kingdom London, we were keen to build in some form of capturing metrics. Now, three months after opening, we’re able to analyse the data to see if it confirms our design choices, our assumptions and the lessons we learned from usability testing.
Interestingly, comparable figures for interactives are difficult to find, so this work is helping us form a benchmark for future interactive development. Of course, the storytelling content and type of experience is unique in each case, and there are many variable factors at play (location, positioning, expected footfall being a few), but I am hopeful we can use these insights to help inform future digital projects.
Data-informed, or data-driven?
Tom Scott has written about the importance of metrics and performance indicators in the Wellcome Collection’s approach to designing digital services. He explains that “the data we collect is used to help inform us and used as evidence rather than being the primary or sole driver.” I think this is also the case here at National Museums Scotland, where we’re increasingly using data to inform digital product development and understand more about visitor behaviour, rather than aiming for a fully ‘data-driven’ approach where we can action rapid cycles of testing, measuring and changing.
What is an interactive anyway?
The term ‘interactive’ is used within National Museums Scotland and other museums to describe a ‘gaming’ or ‘discovery’ type touchscreen digital experience, and is used to differentiate from our suite of fixed-format ‘digital labels’. I’ve documented the user research we conducted into digital labels which helped inform our approach to these galleries, and our Digital Producer Hazel Saunderson has also written about our approach to digital label content production.
We spent a year creating five interactives, so I’ve distilled some of the key lessons from each below:
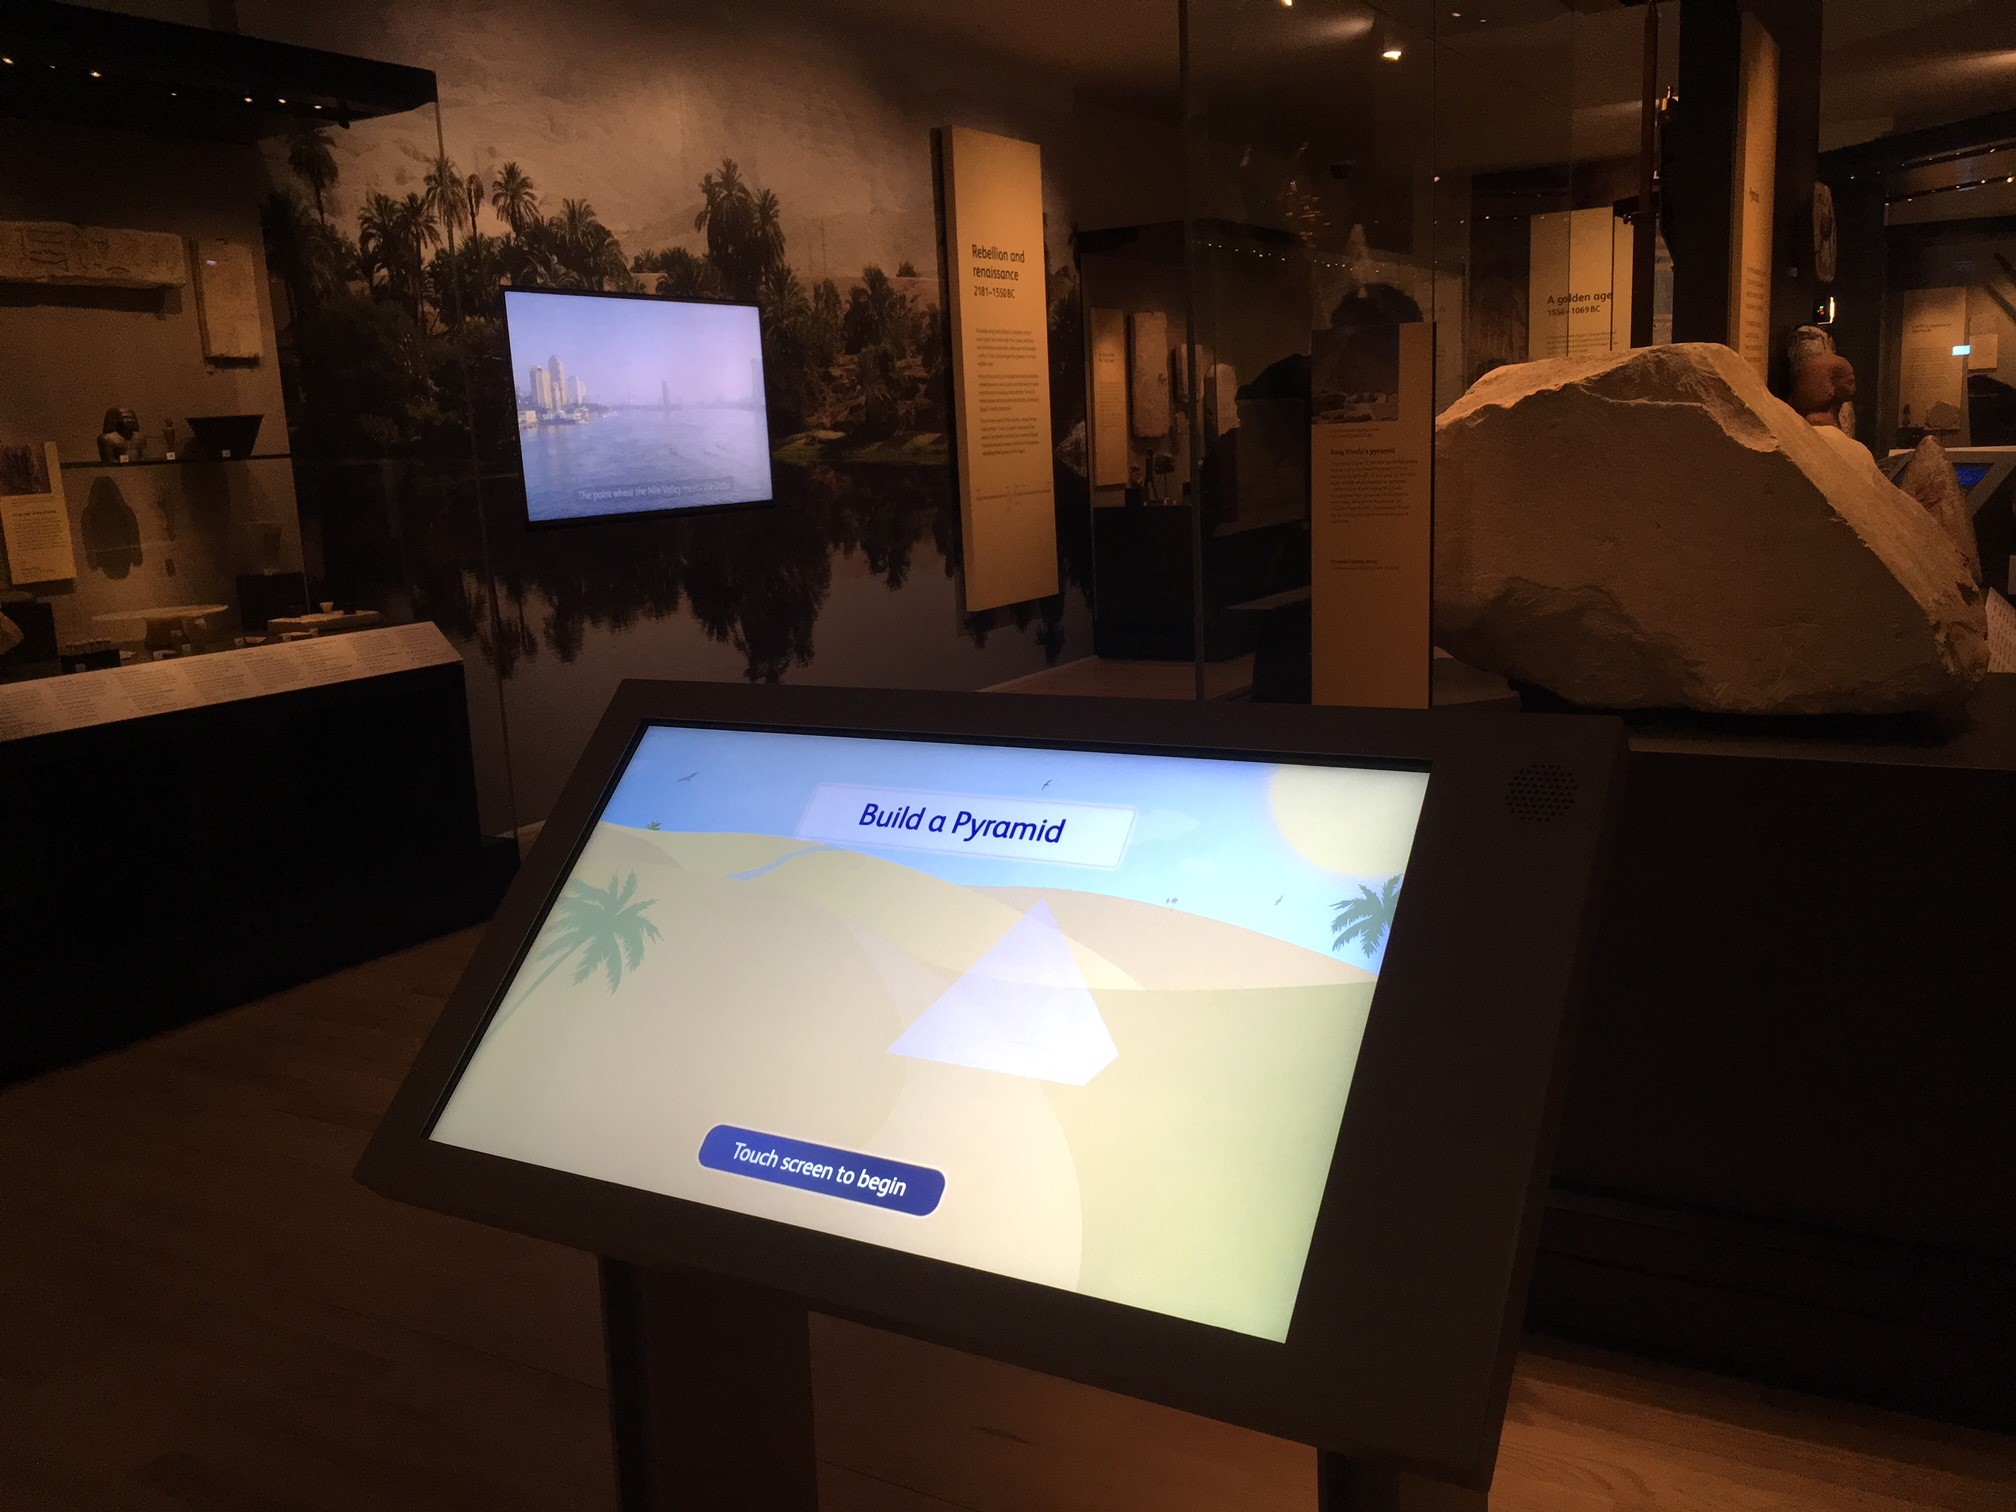
Build a pyramid
Concept
Visitors are challenged to build the best pyramid they can within certain constraints, choosing a shape, materials and workforce. Success is judged by how long their pyramid survives and how impressive it looks.
Design decisions
This interactive is positioned facing the main entrance into the gallery, so is one of the first things visitors see. The gallery is also expected to be popular with school groups due to ancient Egypt featuring on the curriculum, so we expected it would see a significant number of plays compared to the others in the space.
Build a Pyramid is designed as a single-player game, but intended to be deliberately quick and fun, so visitors could watch and play in groups and get competitive with their scores. We also included a feedback loop within the game as a way to add an unexpected learning opportunity, where a scenario appears during the pyramid build, and the user is asked to choose their next course of action before their final pyramid is revealed.
What does the data tell us?
We can see from the data that Build a Pyramid is the most popular interactive in the new galleries, with an average of 174 daily plays, totalling over 15,000 in the three months since opening.
What’s interesting is that it has a 91% completion rate which is probably because it was designed to be completed and repeated, so visitors could test their choices and then revise them a second or third time.
It was also designed to be quick to complete, and takes around two minutes in total. I’ve seen groups play it together and try to beat each others scores.
[edit October 2019: Build a Pyramid has since been converted into a web-based game. Give it a try and tell us what you think in the comments below.]
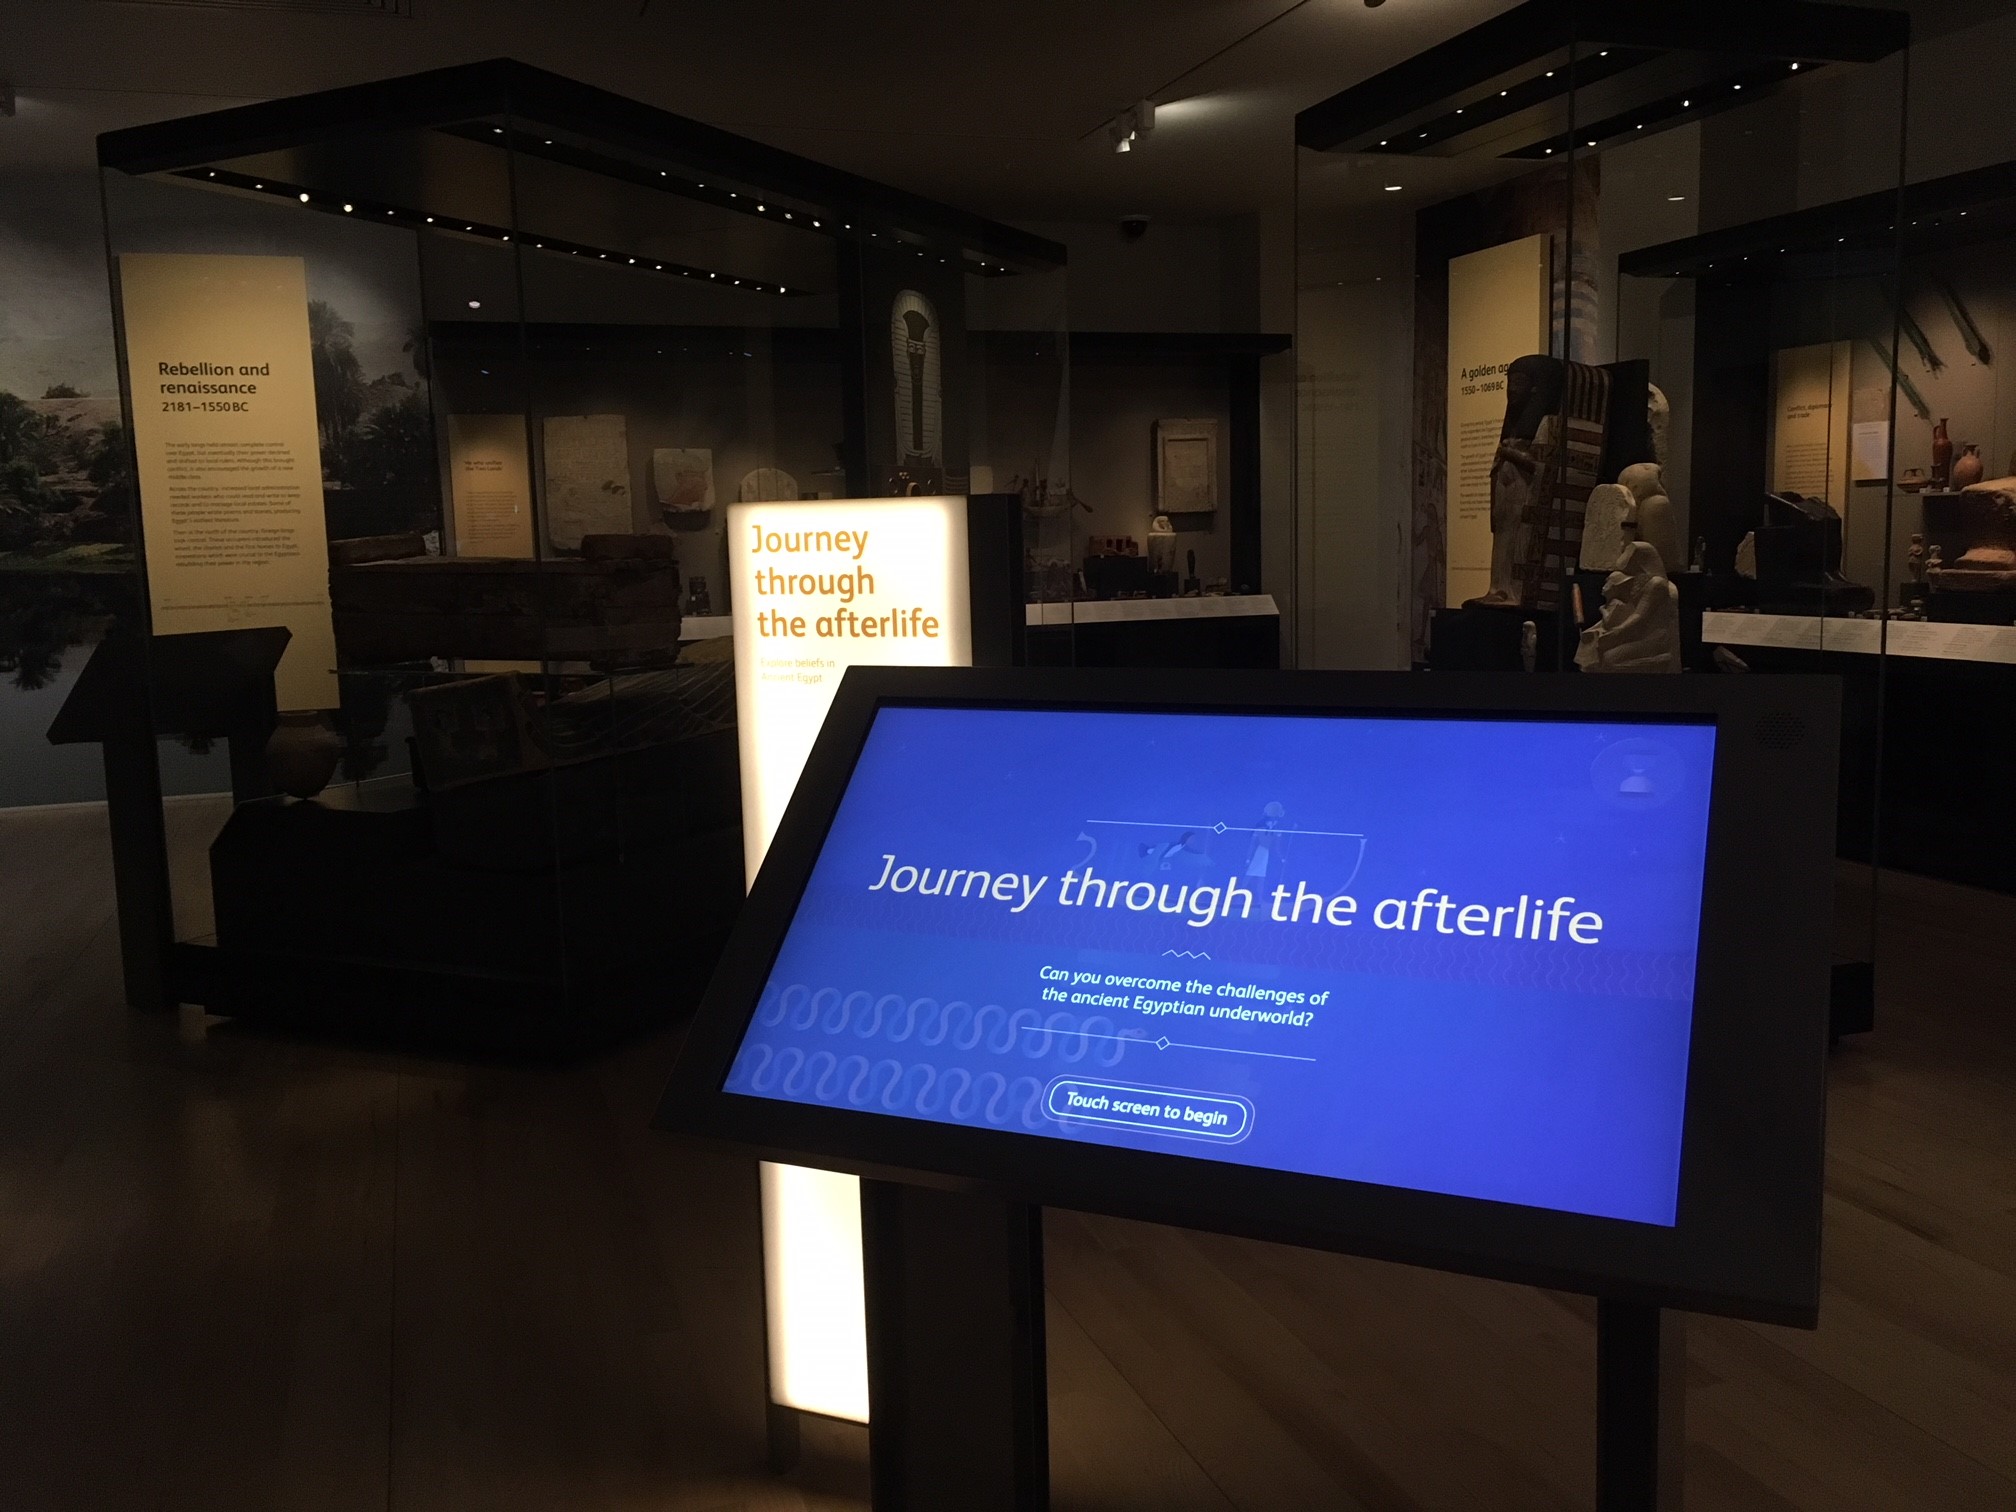
Journey through the afterlife
Concept
Ancient Egyptians believed in life after death, but a person’s fate in the afterlife was uncertain and their journey was fraught with dangers. Journey through the afterlife focuses on the rituals and beliefs associated with preparing for the ancient Egyptian afterlife. The objective of the game is to progress through three challenges, with success or failure determined by the player making correct choices and performing tasks successfully.
Design decisions
Our focus in this interactive was to keep each challenge as simple as possible and help nudge the visitor through each one.
The creative direction of this game was the trickiest, due to the complexity of the topic and the need to explain complicated concepts in simple ways. Our curators used the ‘Book of the Dead’ – the ancient Egyptian book of magic spells used to navigate the afterlife – as inspiration to help identify beliefs and rituals which could be suitable for fun, engaging digital games. We originally intended for this to be one game, but the richness of the content meant it was difficult to simplify into one game, so we decided to expand it to three challenges, each tied to key learning outcomes:
- The upside-down world – death is the opposite of life, and ancient Egyptians feared that in death, the world would turn upside down. You need to memorise a hieroglyph spell to turn the world the right way up
- Defeat the snake god – you must defend the sun god from the snake god Apep as he travels in his boat. Throw your spear to stop the snake god devouring the sun god and stopping the sun rising again
- Judgement of the Dead – to pass judgement you must choose between sets of ‘good’ and ‘bad’ hieroglyphs
We considered introducing an additional scoring mechanism where the user had to collect ‘amulets’ as rewards, but considered this to be adding additional cognitive load (in addition to more design and development time, and therefore budget).
What does the data tell us?
A ‘completion’ is counted in the analytics data when a visitor completes all three challenges and successfully returns to their tomb to watch over and protect their family from the afterlife.
The visitor can complete the three challenges in any order, so it’s possible that around half of visitors who engaged with the game tried at least one, but didn’t complete all three.
When scoping out the user flow we assumed that most visitors would progress through at least one challenge, and we can see that 87% of visitors are achieving this so far. Overall, 51% of visitors who played the game completed all three challenges, which we consider to be good (based on this being a slightly longer game). This could be due to the level of complexity, and attention span/time required to complete it in full.
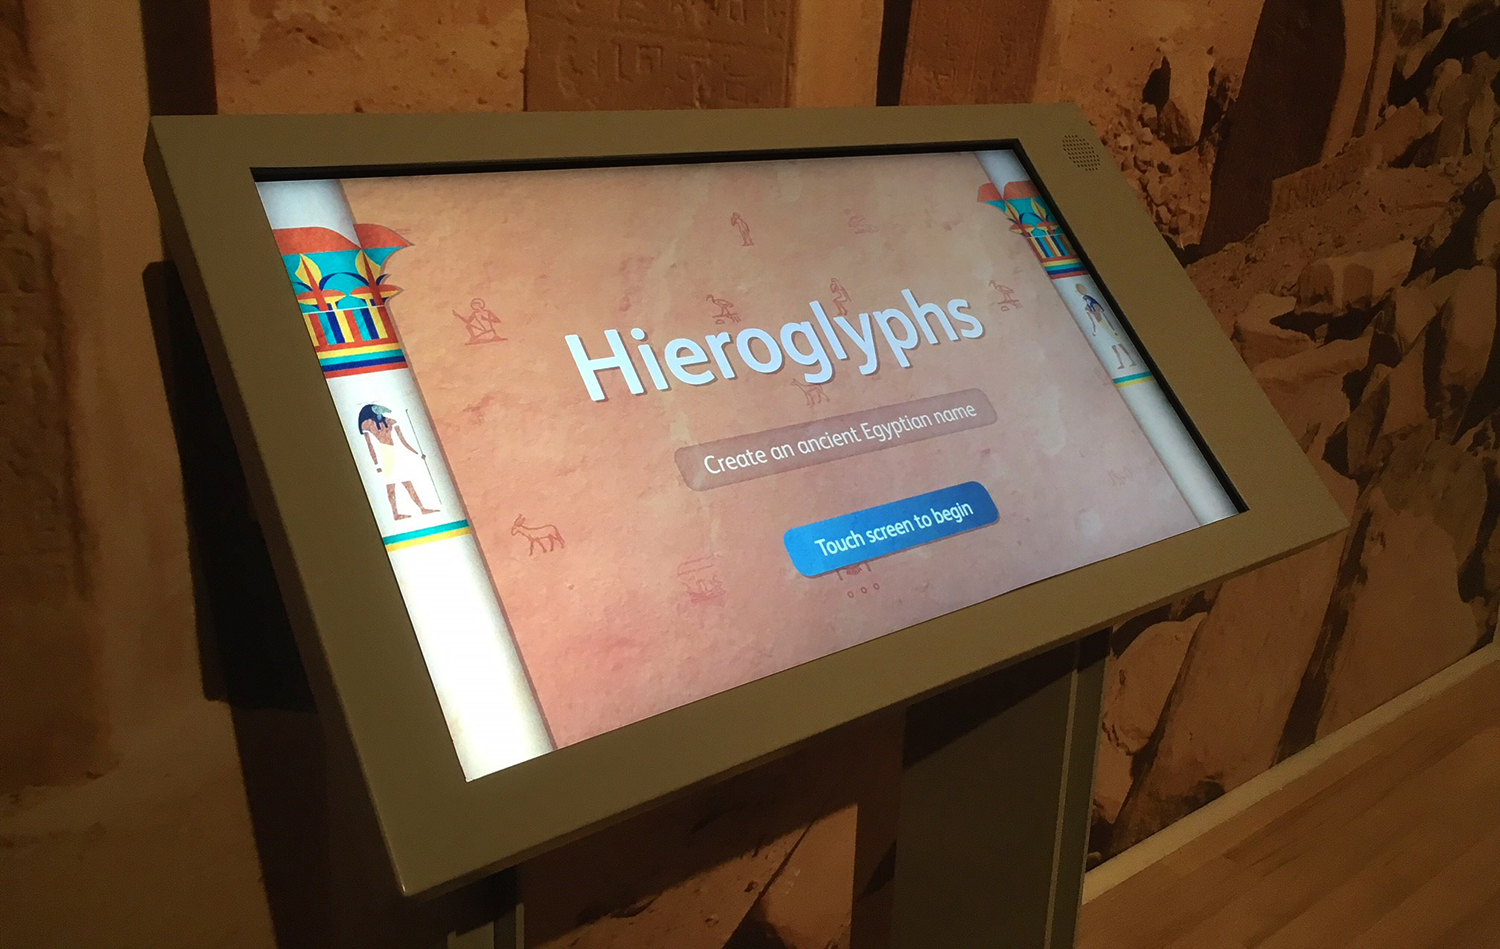
Hieroglyphs
Concept
This interactive encourages visitors to create an ancient Egyptian name by combining different hieroglyphs with various meanings (healthy, strong, happy) which describe their character.
Design decisions
Once our curators had explained how hieroglyph names are constructed, we attempted to create three distinct sets of choices for visitors to choose from, to keep the build process simple and linear. This structure was partly built around the key learning outcome of understanding that Egyptian names often include names of goddesses/gods or kings/queens (as a way to honour them).
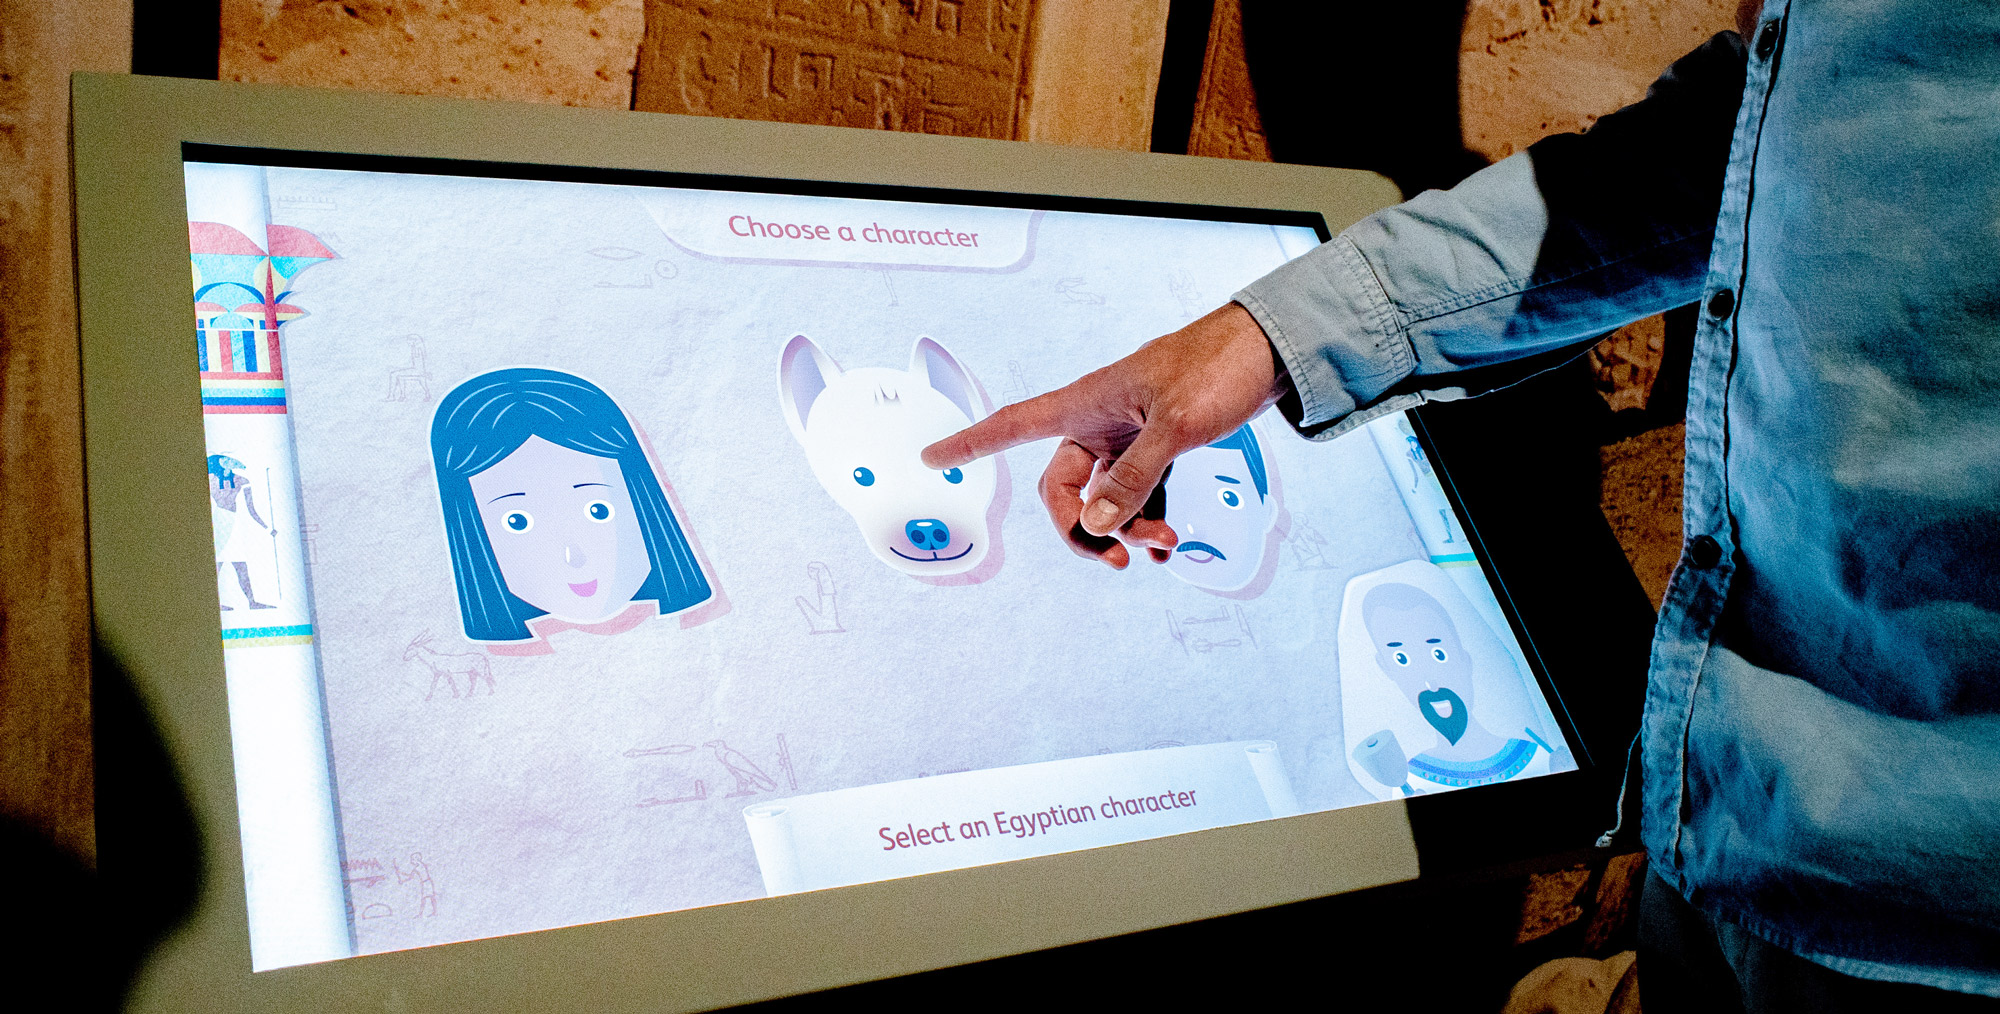
Visitors are then asked to choose a ‘power’ (for example healthy, strong, happy) as a way to endow this characteristic on their character. They are then asked to choose a final symbol which becomes a visual indicator (male, female, donkey, cat, dog etc) when the name is displayed in the final screen.
Getting the terminology right was the trickiest part of this process, as we tried to choose titles for the ‘powers’ and ‘end symbol’ which made sense to the visitor. The ‘end symbol’ is actually known as a ‘determinative’, but this was unsuitable for the target audience, so we had to create a title which worked in context. We also had to work hard to stay true to how hieroglyphs work in a grammatical sense, which proved tricky when trying to keep the game play simple and repeatable.
What does the data tell us?
Like Build a Pyramid, this game is very linear. The completion rate of 92% reflects the simplicity of the step-through-process, and supports the recommendation to keep the flow of games as direct as possible. The content can be rich and fun, but should be structured in a way which is easy for the visitor to navigate, and uses simple signposting to give the visitor the payoff they expect.
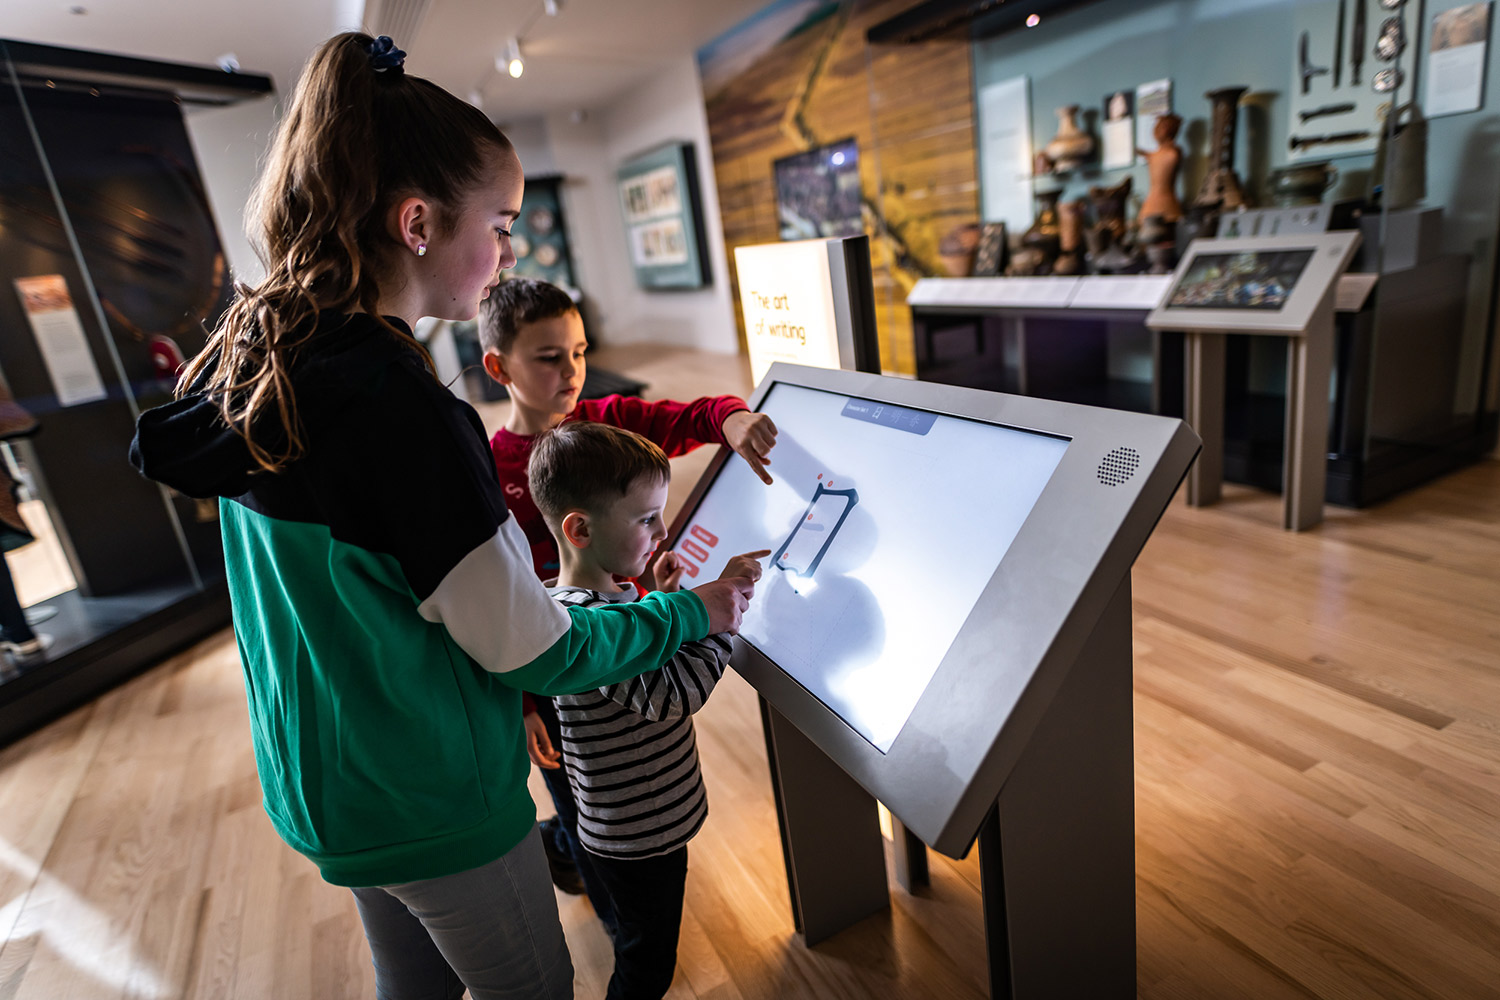
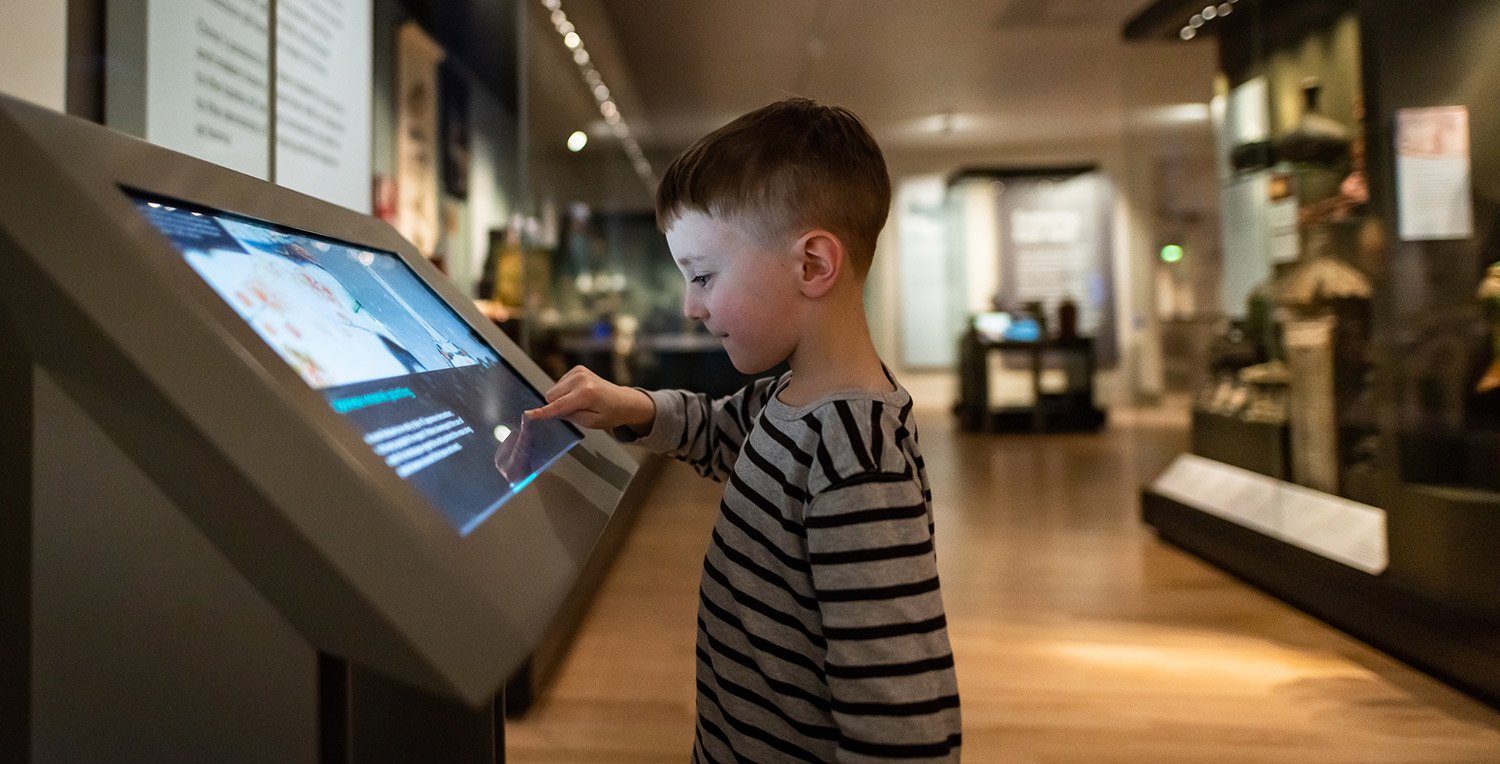
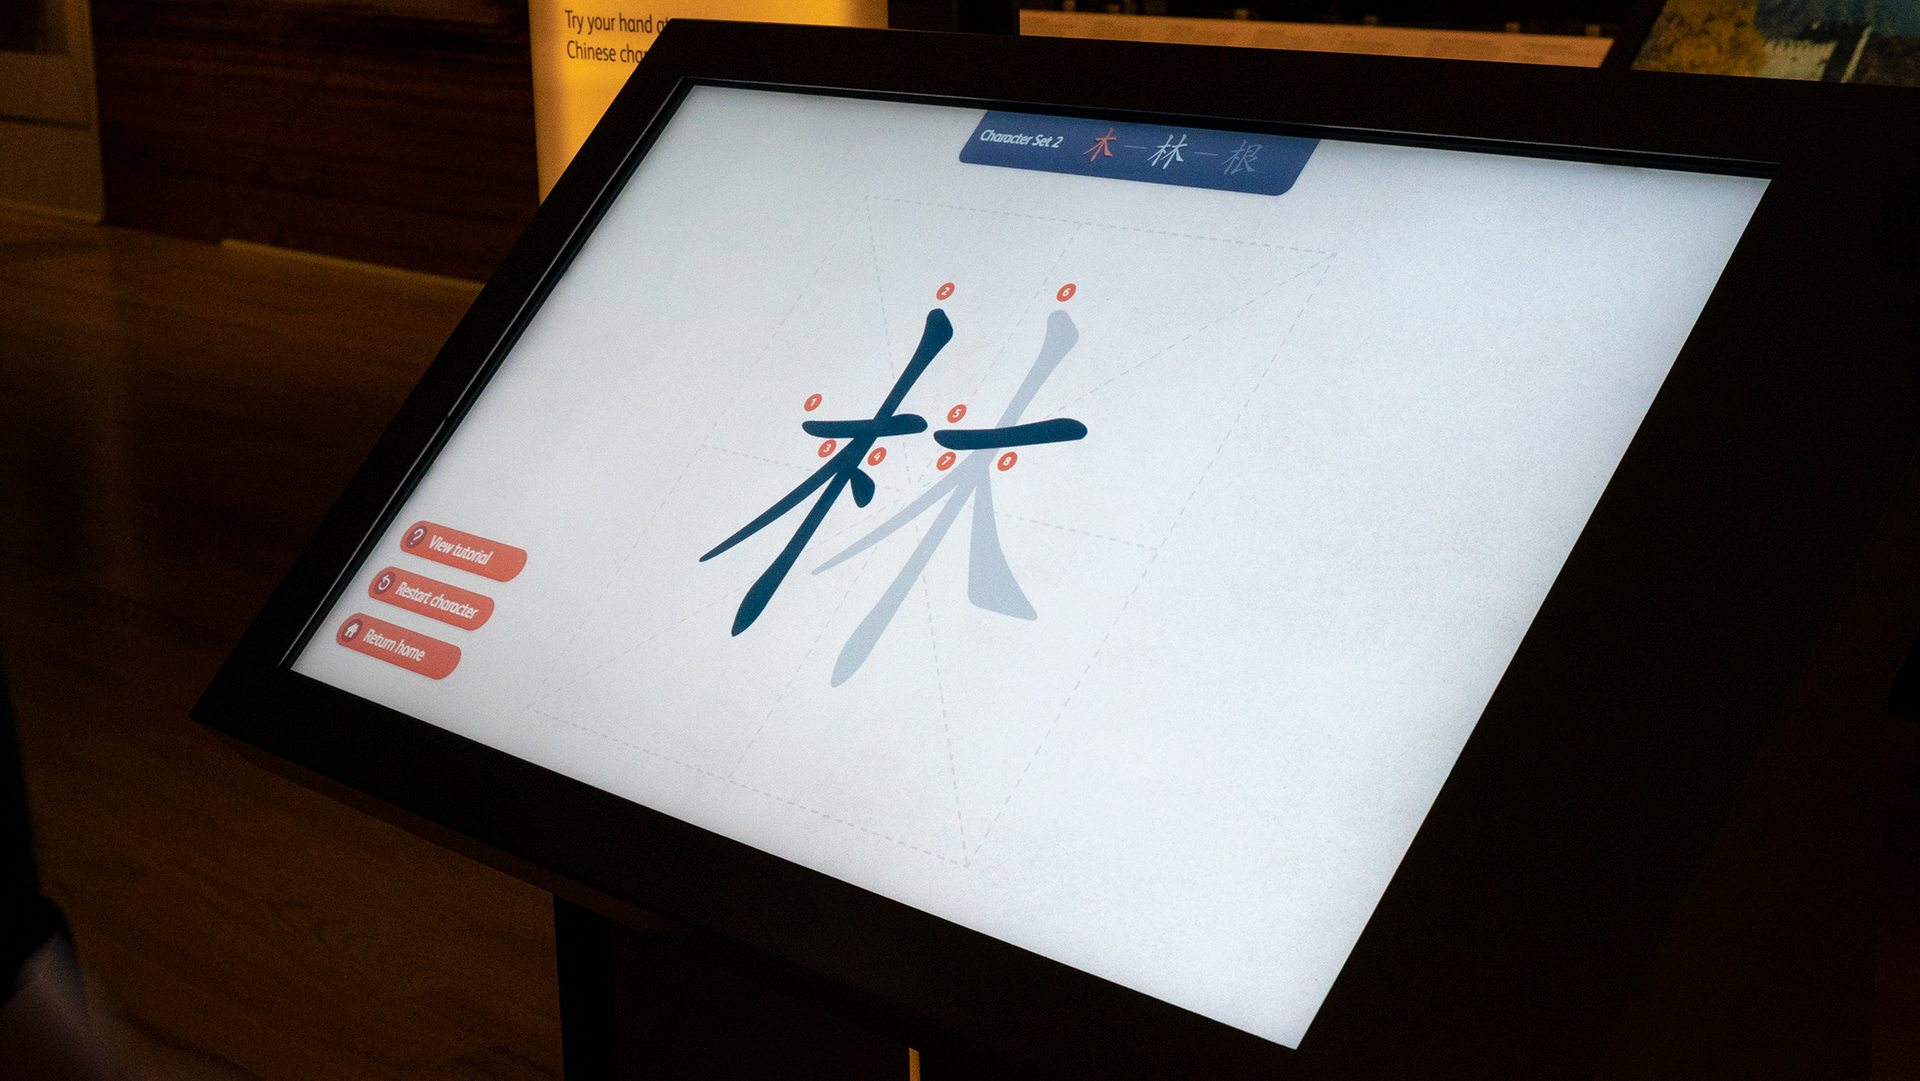
The art of writing
Concept
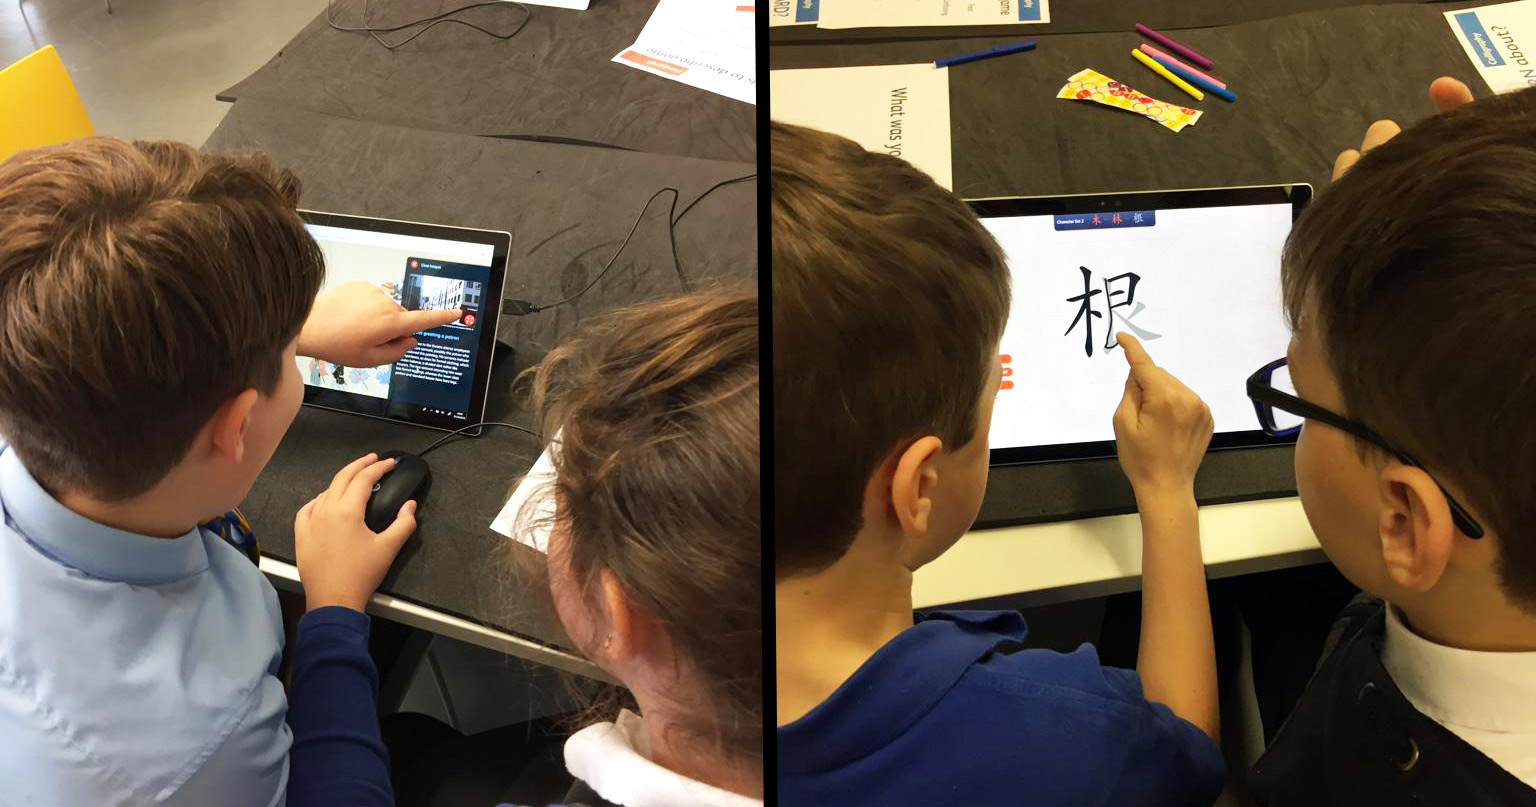
This interactive encourages visitors to draw a progression of Chinese characters to learn about the importance of the order of strokes, and how characters can be changed to alter or enhance their meaning. A series of three characters are shown on screen for the visitor to memorise and draw in order. Visitors can progress through two character sets, each developing in complexity.
Design decisions
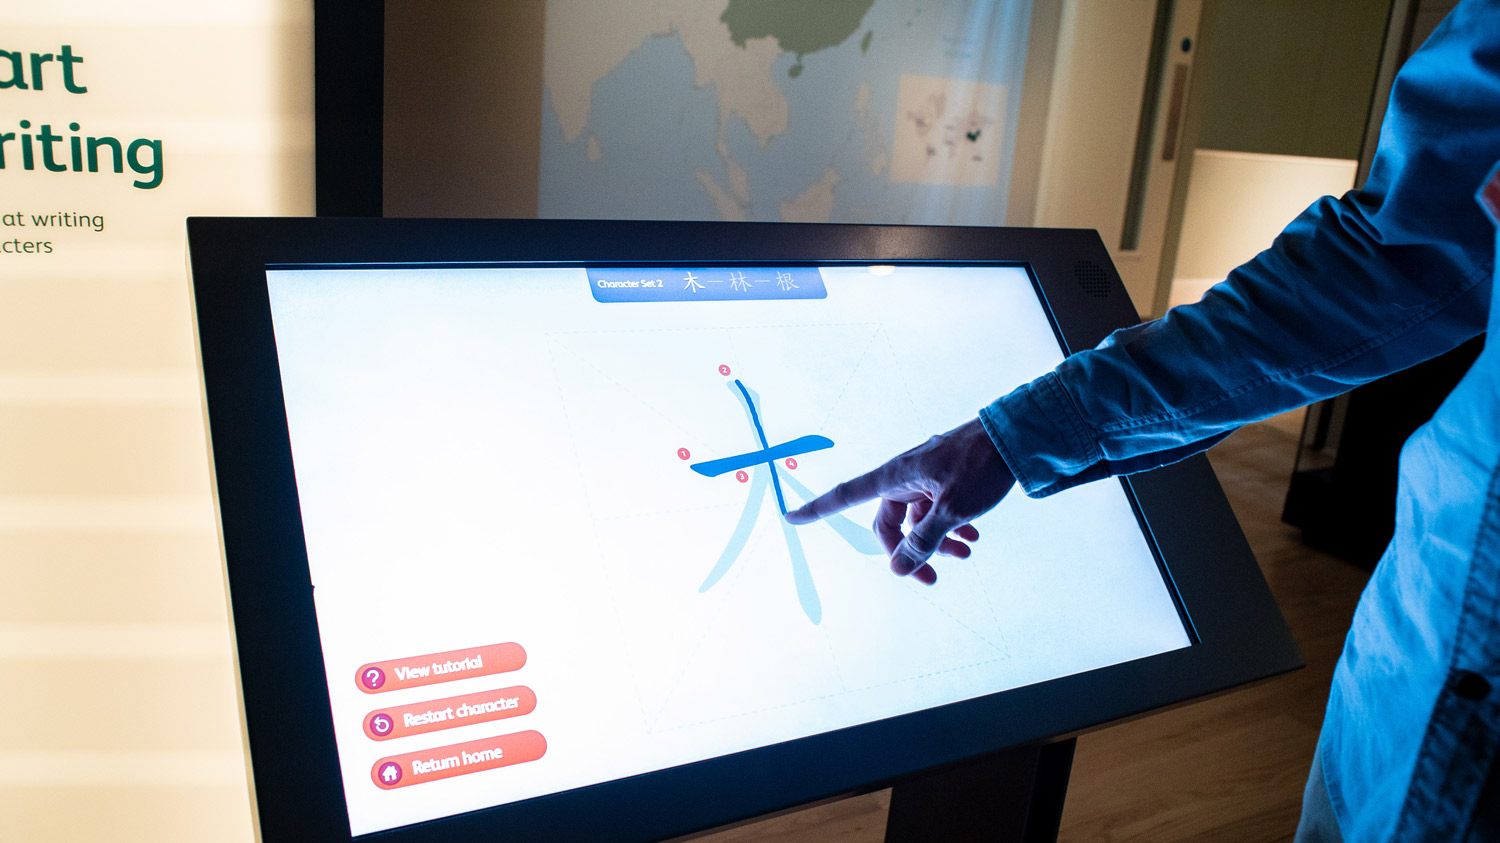
The emphasis was with the art of writing was on elegance and creating a slow, therapeutic experience. We aimed to use the touchscreen technology to help visitors to try something they wouldn’t normally be able to.
During the design process we debated whether to include an additional character set, as we considered that this would offer a richer experience (and things tend to work well in threes). However usability testing revealed that people enjoyed the slow and contemplative nature of the drawing process, and due to this it took more time than expected for visitors to complete the characters in both sets.
What does the data tell us?
The data tells us that a significant proportion of visitors are engaging with this interactive (its the third most popular), which is perhaps down to this being the only ‘game-based’ interactive in the East Asia gallery (the other, Exploring the Handscroll is more of an interpretive viewing experience).
The screen is larger than the Handscroll at 32″ and shows slow animated character attractor animation when not in use, which is designed to draw visitors towards it. Anecdotally, feedback has been positive, and we’ve seen Chinese visitors drawing the characters, snapping images of it and sharing them on the WeChat social network.
Exploring the Handscroll
Concept
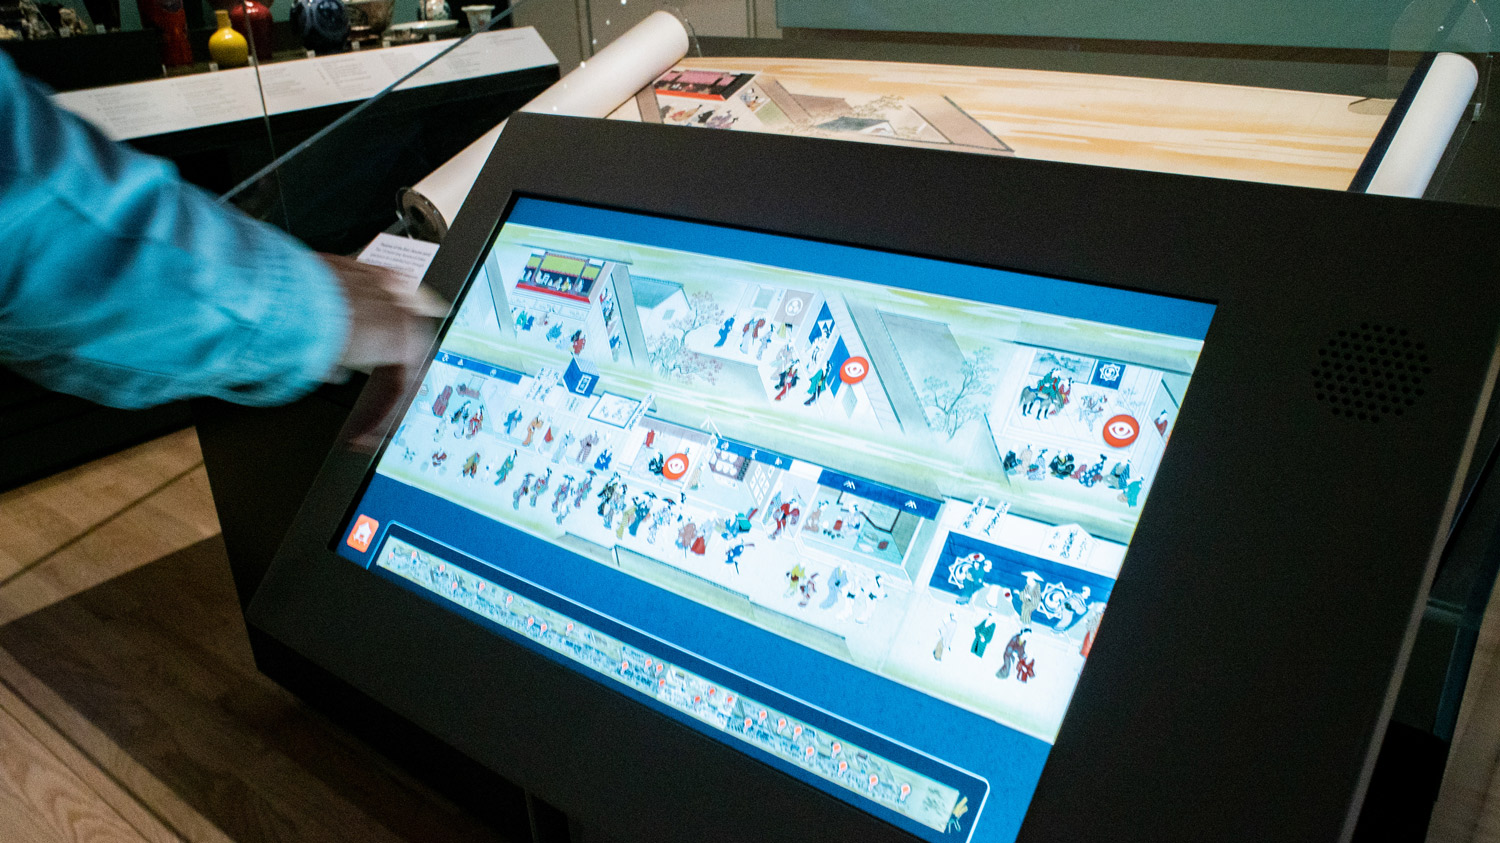
The interactive focuses on a 13-metre-long handscroll which shows the bustling street life in the theatre district of Edo (today’s Tokyo) around 1700. Entitled Theatres of the East, the handscroll shows people enjoying a range of entertainment from puppet shows and Kabuki theatre to comic skits and private parties. With only a few metres of the handscroll on display in gallery, the interactive allows visitors to virtually unroll the rest of the scroll, using hotspots to guide them to key scenes and points of interest.
Design decisions
This was the simplest user experience to define of all the interactives. Our curators picked out the key scenes which were turned into ‘hotspots’. The main design decision was around the number of hotspots, and the types of content which should be presented for each one.
What does the data tell us?
With a 22″ screen this interactive is the smallest of all touchscreens across both galleries, which may be a factor in the relatively fewer views it had in the opening three months.
It is also unique in that the four other interactives are focused on broader stories relating to ancient Egyptian and East Asian culture, whereas this is a stand-alone experience linked to a specific object offering visitors a slower exploration of its stories.
Usability testing
We were keen to get early prototypes in front of different test groups, with one of these being primary school pupils (our target audience). We’re lucky that we have a regular flow of school groups coming through the museum, so we were able to use interactive wireframes to gauge the opinions of young testers in early July and later in the development in autumn 2018.
The later sessions with Inverkeithing Primary in Fife and Greengairs Primary in North Lanarkshire were really useful for helping us refine the flow, check navigation and signposting was obvious and ensure that the language was age-appropriate (some terms were too complex).
This stage was essential to help us check which games were easy to understand, and which had been over-engineered. We also learned how useful it is to provide younger testers with stickers as a way of voting!
The numbers
The data below covers the first three months since the galleries opened (8 February to 7 May 2019).
- There’s been a total of 43,837 sessions/plays since opening on 8 February
- There was a 76%/24% split in interactive engagement between the ancient Egypt and East Asia galleries (this was expected, due to the greater volume of school group visits to ancient Egypt and the link to the curriculum)
- Completion rates were high across the board (see table below), particularly on Build a pyramid and Hieroglyphs (which are both linear games)
Interactive |
Total Sessions (plays) | Average daily sessions | Average completion rate (%) |
| Build a pyramid | 15,323 | 174 | 91% |
| Hieroglyphs | 11,973 | 148 | 92% |
| The art of writing | 7,192 | 81 | 66% |
| Journey through the afterlife | 6,059 | 74 | 51% |
| Exploring the handscroll | 3,290 | 37 | 61% |
Observations
- Build a Pyramid is the most popular with the most plays, and a high completion rate of 91%. This was expected, partly due to it’s position in gallery and also it’s link to the curriculum
- Hieroglyphs performed better than expected, as we expected that its position at the back of the gallery would lead to fewer plays
- The Art of Writing has a lower completion rate, though this experience is about showing character development, rather than the linear experience of ‘completing’ a straightforward challenge – keeping two character sets rather than adding another would have been too much, so looks like the correct decision and reinforces the point around keeping things simple and focused
- Journey through the Afterlife has the ‘lowest’ completion rate, which was expected, due to it being a more complex user journey (the visitor needs to complete all three challenges and return to the tomb to ‘complete’ it in an analytics sense). However it’s interesting that a significant number of users (51%) still completed all three challenges
- Exploring the Handscroll has the lowest number of sessions, which was also expected as it is more an interpretive viewing experience than a ‘game’
Does the data confirm our design assumptions?
We designed the experiences with the following key principles in mind. We were able to influence some of these factors more than others, but it is interesting to look at the data and understand if the design assumptions we tested followed through into the ‘live’ gallery environment:
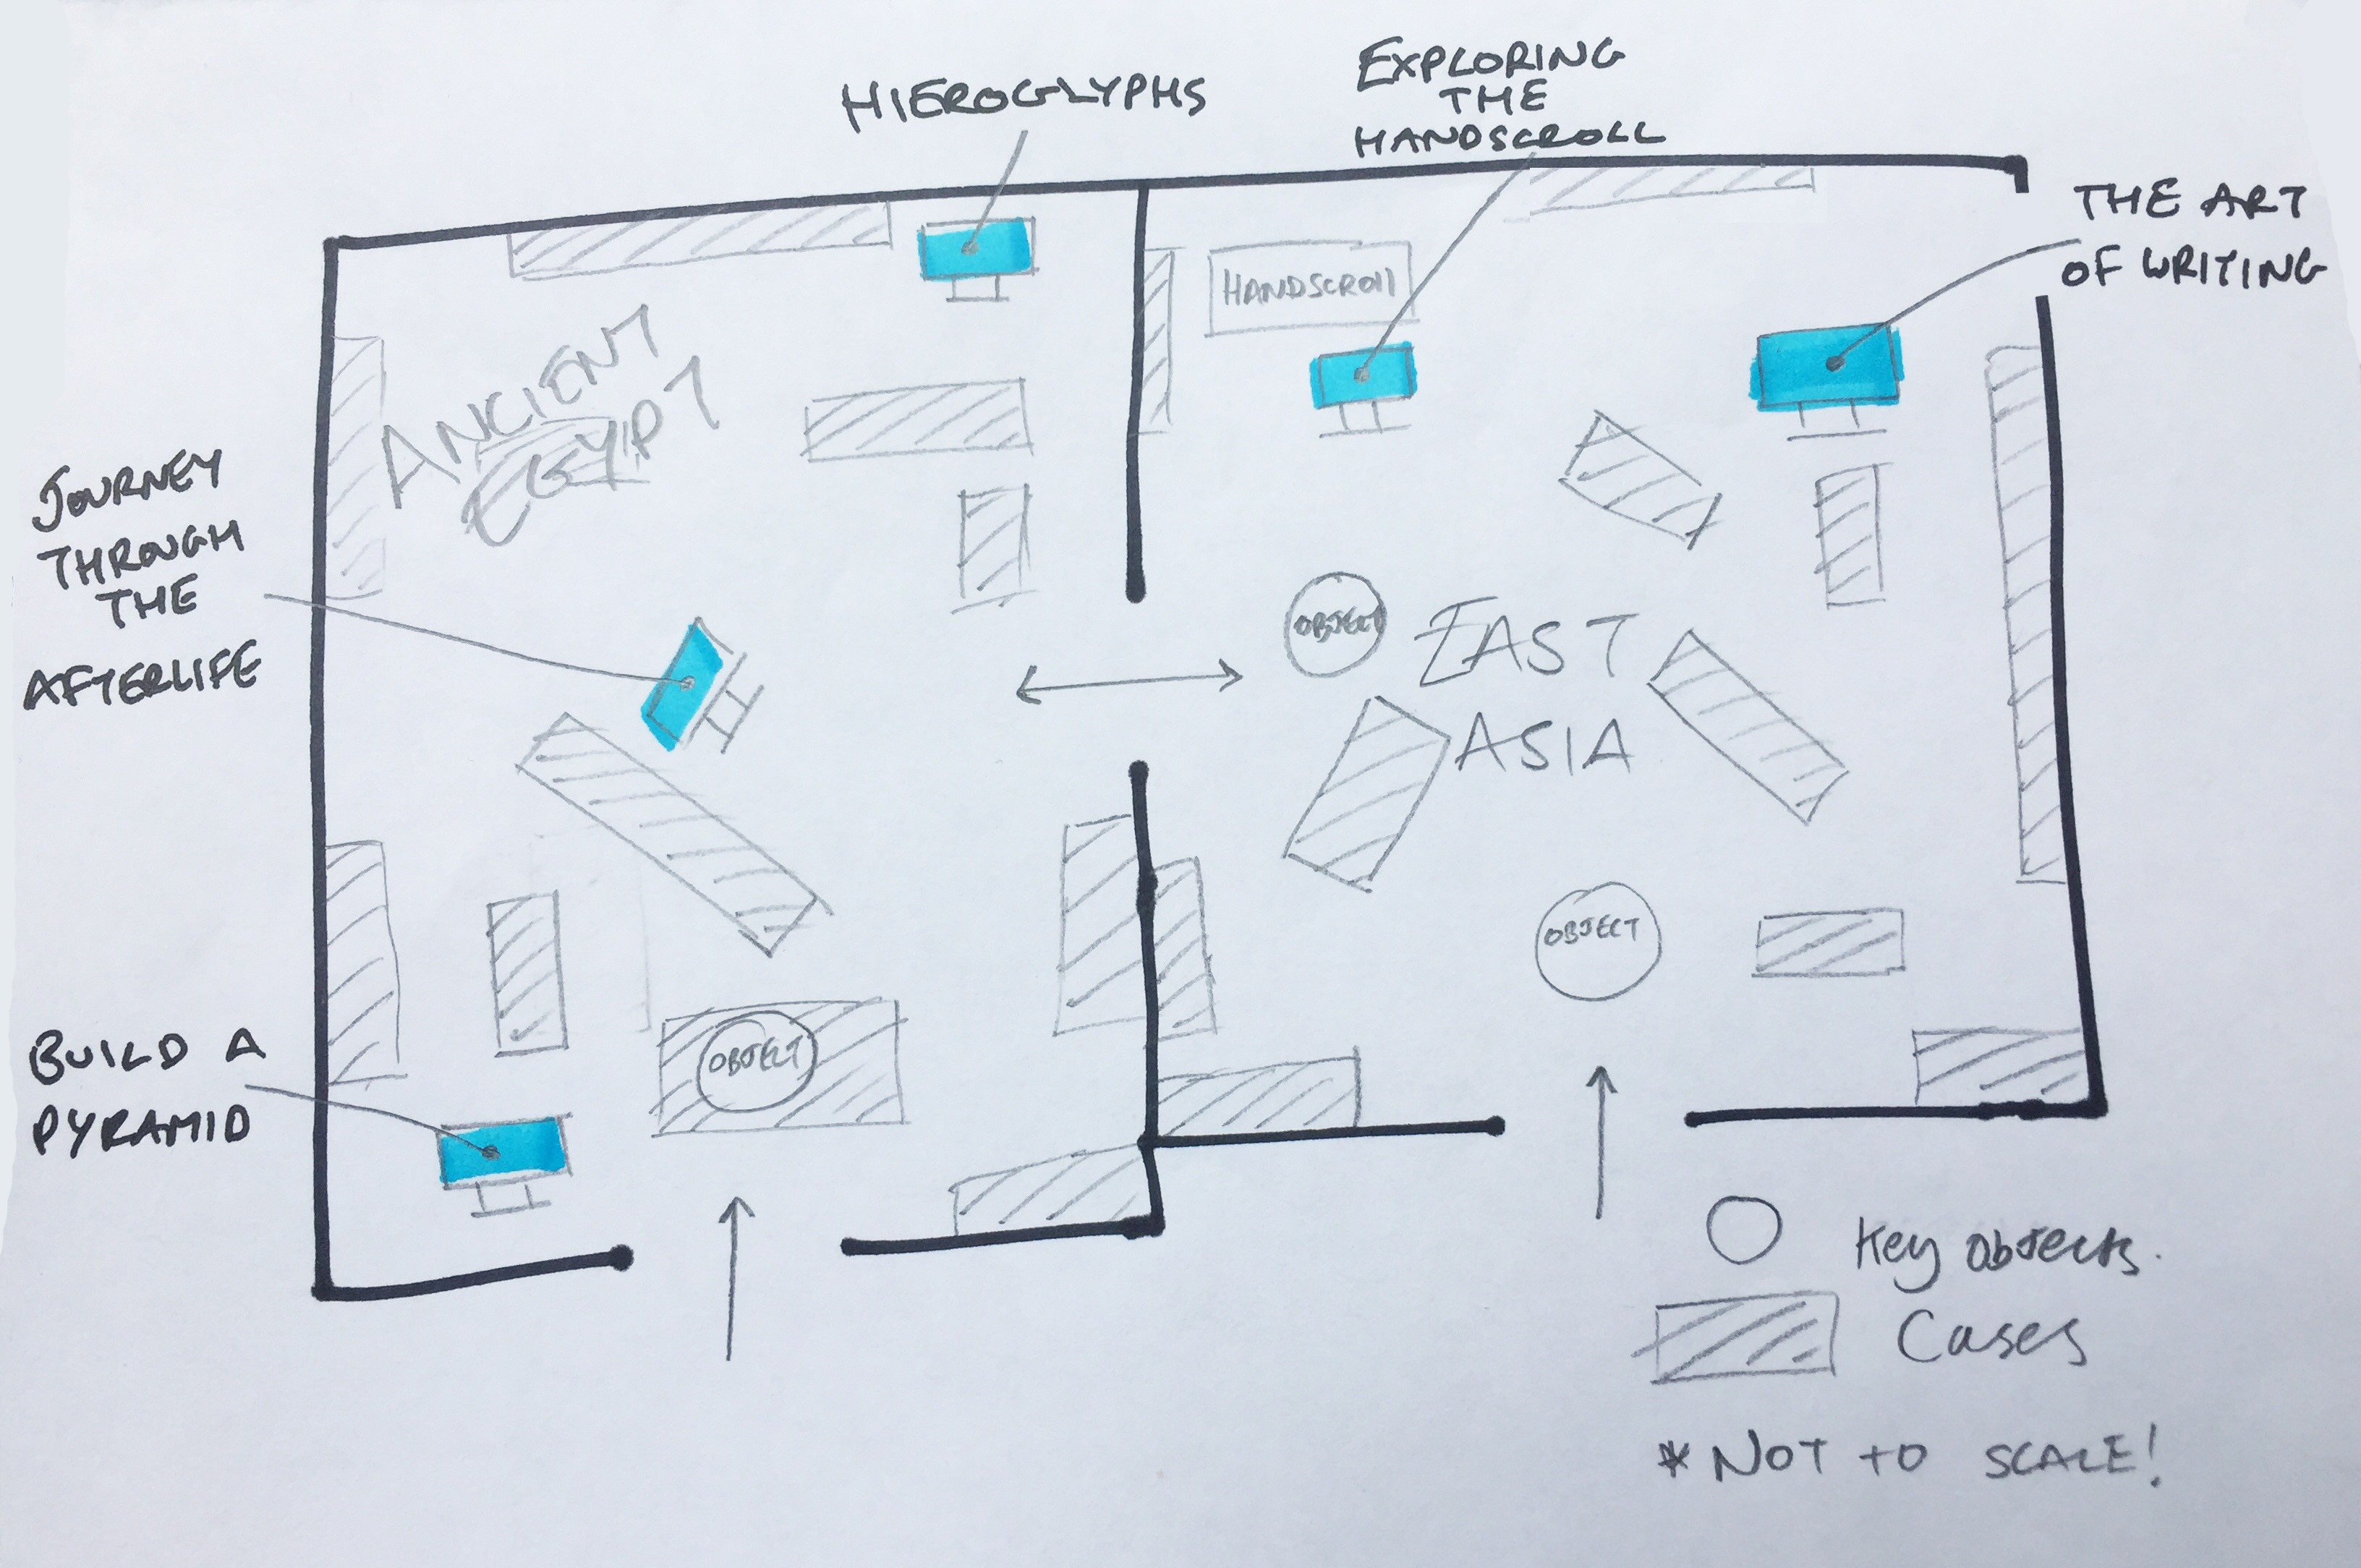
1. Location and positioning is key
Build a Pyramid proves this to be true, as it faces the main gallery entrance where the majority of visitors arrive, and has had the most plays. However the high number of plays for Hieroglyphs challenges this assumption, as it is positioned in the back corner of the gallery against a wall, with no objects within direct line of sight.
The map sketch below shows the position of each interactive along with gallery entrances and suggests how visitor flow can impact engagement levels with screen-based content.
2. Visitors respond more to content which is explicitly related to objects/images in their eye line
This principle isn’t shown to be true in this context, as the handscroll interactive is the only one which has an explicit connection to the object, but has the lowest engagement (in terms of numbers). There are objects designed into all the Egypt interactives which reference objects on display, but not in a way which is as explicit as this. Conversely, Hieroglyphs is positioned against the back wall with no objects in the visitor’s eye line, and has performed much better than expected.
3. Aim for simplicity: Less is more
This is of course contextual, but the principle around focusing on fewer messages rather than trying to pack in too much content has been shown to be true. The two ‘simplest’ interactives in terms of a linear game play experience (Build a Pyramid and Hieroglyphs) have seen higher ‘completion’ rates than those with deeper content (Journey through the Afterlife and Exploring the Handscroll).
It’s worth noting that the ‘completion’ triggers are also contextual for each interactive, and aren’t directly comparable. When designing experiences like this, setting the appropriate goal/completion metric really depends on whether the aim of the interactive is to deliver a linear ‘in-and-out’ learning experience, or whether the aim is to create a deeper, more contemplative experience.
Planning to iterate
While the data gives us insight into how these products are being used by visitors in gallery, the nature of budget planning for big capital projects like this one has traditionally meant that the majority of the budget is invested in creating briefs, prototyping and testing, before final build and launch.
To move towards a product life-cycle approach we’d ideally look to allocate a proportion of the overall budget to ongoing iteration and maintenance over the course of the gallery life-cycle, meaning we could continually act as we understand user behaviour further.
We will keep tracking the stats to see how visitor behaviour changes over time, not least to gauge the overall impact of in-gallery digital experiences. It’s always great to know that thousands people have played something you’ve helped create, and of course, even better if they’ve played them all the way through.