

COP27 is currently underway in Egypt, with various nations working to tackle the global challenge of climate change. In this post, our Principal Curator of Science Rebekah Higgitt showcases our historical weather recording instruments, how they were used and what they can tell us about the changing climate.
We have never been more aware of the weather. Although we’ve always been a weather-conscious nation, our increased knowledge of changes to the global climate over time gives new meaning to our experience of local conditions that may be wetter, dryer, windier or warmer than usual.
Well before the possibility of climate change was widely acknowledged, general interest in weather led the Museum to put it on display. Not only were meteorological instruments included in its displays but, in the early 20th century, some of these were working instruments, measuring weather on the roof of the Museum and displaying the results to visitors in the gallery.
Once state-of-the art, some of these instruments are now historic artefacts and part of the Science Collections. They include a rain gauge, sunshine recorder, anemometer (to measure wind speed and direction) and thermometers. They were self-recording instruments that could produce real-time paper records.
The Museum’s annual reports tell us when and why these instruments were bought. A crucial context was that in 1901 the Museum was transferred to the Education Department. This new focus also prompted the foundation of the Technological Department, which was tasked with forming a collection for “teachers and students of the science and technical classes”. This developed quickly into a School Gallery, focusing on models and instruments “too costly to be in the possession of the majority of science schools and classes”.
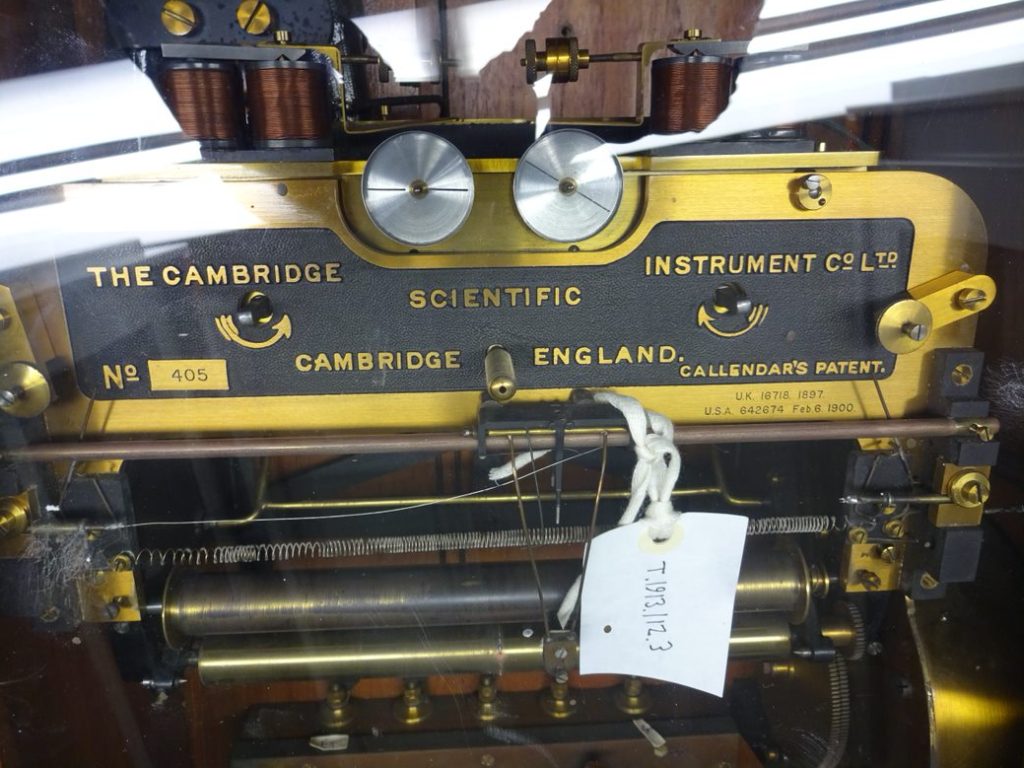
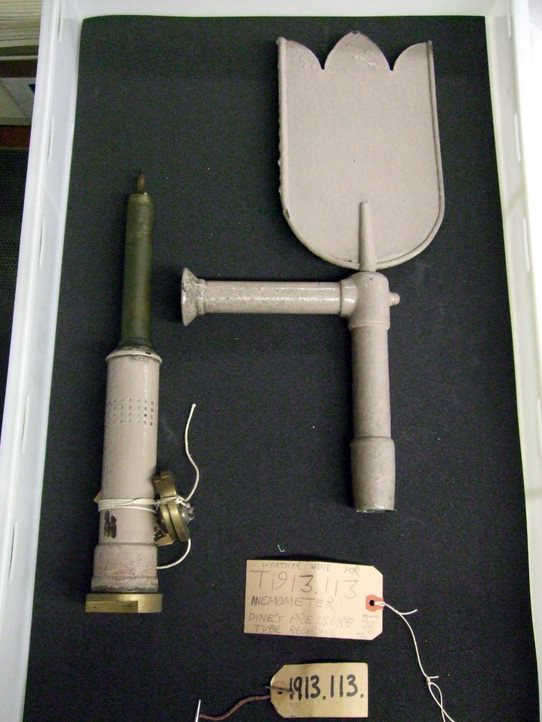
They included meteorological instruments, such as “a recording rain gauge” and, from 1913, “a recording thermometer of the type introduced by Professor Callendar” and “a recording anemometer of the Dines type”. The former was “of a most ingenious and elaborate character”, based on the principle that the electrical resistance of metals changes according to temperature: the thermometer was a long, fine platinum wire, placed on the Museum roof. The continuous record produced by each instrument was viewable in the gallery below.
We have a sense of how teachers and pupils were supposed to make use of these displays from materials produced by the Museum for the Edinburgh School Board in 1911-12. It was suggested that “The weather and the instruments of Meteorology” could “be used to give definiteness to a subject of common experience and conversation”.
Today, these instruments offer rather different lessons. Of particular interest are the historic records they produced. Being able to compare current and historic data is essential to meteorologists and climate scientists. It is also valuable that we should be able to link this data to the individual instruments that produced them.
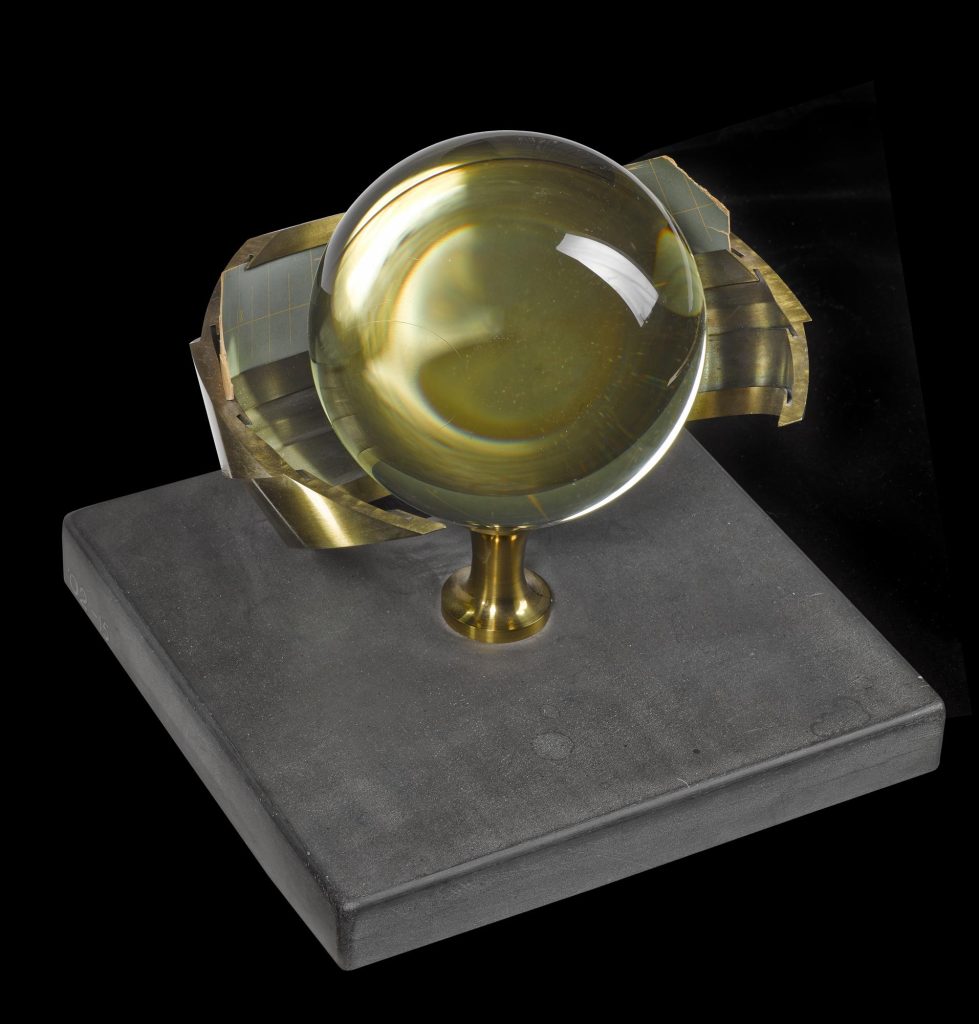
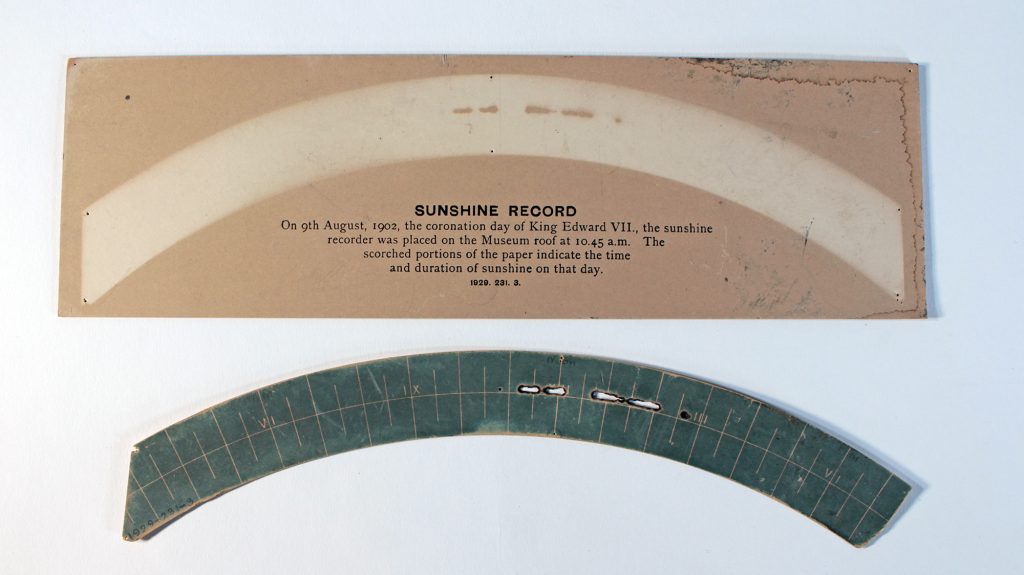
For example, we know from surviving correspondence with the Cambridge Scientific Instrument Company that there were ongoing problems with getting the “elaborate” recorder to work reliably. Some of the more reliable data entered the collections. Displays of readings from the Campbell-Stokes sunshine recorder (made directly by the sun’s rays burning through the recording paper) helped visitors understand how the device worked and allowed them to compare a day of continuous sunshine with the intermittent sunny spells recorded on the day of Edward VII’s coronation, 9 August 1902.

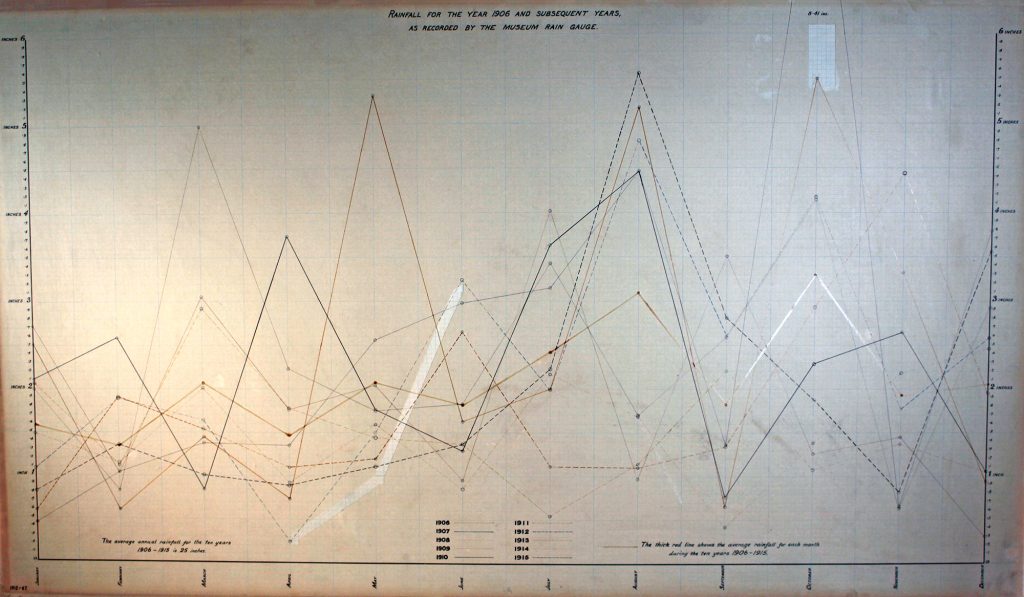
Readings from the rain gauge were averaged and recorded on large charts, each covering a decade, for gallery display. These were kept continuously from 1906 until war intervened in August 1939, showing monthly rainfall in inches. The charts suggest that then, as now, October was usually the wettest month, but there were often peaks in August.
The Technology Department’s correspondence files show that their weather records had practical uses outside the Museum too. As early as 1909, the city’s engineer found the rainfall records useful in planning a drainage scheme for the area around Haymarket, while in 1952 the same office drew on them “during the hearing of the Water of Leith Case”, relating to flooding in 1948.
Understanding current and future weather patterns is ever more crucial for policymakers and planners, to mitigate and adapt to climate change. According to Edinburgh’s 2030 Climate Strategy, the City’s climate is set to get warmer and drier in summer and milder and wetter in winter. The average annual rainfall recorded on the Museum’s roof 1906-1915 was 25 inches (approximately 635mm), which compares with 28.65 inches (727.7 mm) for 1991-2020, as recorded at The Met Office station at the Royal Botanic Garden. There you can compare data since 1961: the trends of more rainfall and sunshine, as well as higher average temperatures, seem clear.
Since the Museum was founded in the 1850s, the Earth’s average surface temperature has increased by more than 1.0°C, with most of that rise occurring since the 1960s. If we allow that to increase by more than another 0.5°C, the consequences will be stark.
Finding pathways to avoiding this will be key to discussions at COP27, with countries like the UK, who industrialised early and are responsible for a high proportion of historic warming, being urged to offer support to smaller nations that will bear the brunt of the changes to come.
Acknowledgements
I’d like to thank Alan Mills, Assistant Curator of Communications, for insights into the department’s historic correspondence, and Riki Ueda for her ideas and useful discussion during her placement at the Museum, undertaken while she was studying for an MSc in Earth Futures at the University of Glasgow.
Through exhibitions, education and activities – and by engaging our audiences in dialogue about changes beyond our walls – we aim to promote awareness and conservation of the natural world and cultural heritage. Find out more about the work we’re doing around these global issues.